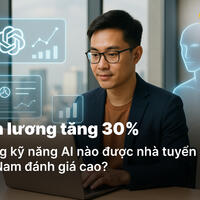
How office workers can move towards evidence-based, analytical thinking
The office world today lives in a paradoxical state: there is more and more data around, but the quality of decisions is often still based on intuition, subjective opinions and "feelings". Financial reports, marketing spreadsheets, HR reports, CRM data - all of this turns into noise if a person doesn't know how to analyze information correctly and present it in a way that allows them to make real, not perceived, decisions.
At Swiss Coding Academy, we see this problem every day. And we are convinced: a modern office worker needs not a new application or "one more tool", but the ability to think analytically, understand statistics and confidently work with data.
That's why on the initiative of SIT Programming School founder Sergey Shedov we created the Data Science for Business program - a course that helps adult professionals move to a conscious, evidence-based approach to work.
Why this course appeared and why it is important now
There are plenty of Excel, Power BI, or "data analytics" courses on the market. But most of them are either too technical (too much math), superficial, or not tied to the real work of office professionals.
Employees face typical problems:
- it's impossible to check the quality of management decisions;
- it is difficult to see errors in reports and misinterpretations of data;
- it is not clear which figures are actually important;
- visualizations look nice, but do not help to make decisions;
- the data is there, but the insights are not.
Data Science for Business is the answer to these challenges.
This program is not for future data scientists, but for office specialists, managers, analysts, marketers, HR managers and executives who want to learn how to use data in their daily work.
Who the course is created for
We studied dozens of profiles of office workers in Vietnam - and identified three groups that are most often looking for this kind of training.
👨💼 1. Senior managers
People 40+ who either don't have time or have a lot of free hours between projects.
Their requirements:
- To be able to verify company decisions,
- see errors in the interpretation of statistical results,
- understand when a report is misleading.
👩💻 2. Middle managers (Managers)
Age 30-40. Often close to career advancement.
Their goals:
- To confidently defend their ideas,
- be able to argue decisions through numbers,
- understand marketing, HR or finance reports.
👨🎓 3. Motivated employees 20-30 years old
Those who want to grow faster than others.
It is important for them to:
- to stand out,
- improve the quality of their work,
- to move from chaotic analysis to professional analysis.
These three groups have one thing in common:
👉 they want to work better - not through intuition, but through analytics.
What makes the course unique is the philosophy of Swiss Coding Academy
Under the leadership of Sergey Shedov, the school builds products around fundamentality, systematicity and evidence-based approach. Children's programs, adult courses, corporate initiatives - everything is based on one idea:
A person makes quality decisions only when he or she truly understands data, not just "knows how to use a tool."
That's why the Data Science for Business course is not just about teaching one program or one method. It teaches thinking, and tools serve only as its manifestation.
What you will learn
The program lasts 5 months (2 sessions per week for 3 hours) and is entirely built around practical application:
1. Business Metrics
What to count, what metrics to use and why. This is the Foundation for all further analysis.
2. Statistics & Google Sheets / Excel
Basic statistics, spreadsheet basics, data processing principles. You will understand how what you use every day works.
3. data preprocessing & complex calculations
- Data cleaning,
- filtering,
- filling in the blanks,
- creating functions,
- complex calculations.
You will learn to work with "dirty" real data rather than ready-made textbook examples.
4. specialized statistics software (JASP, SPSS/Stata alternatives).
Specialized tools that allow you to do:
- regression analysis,
- correlations,
- group comparisons,
- hypothesis testing.
That is, to conduct real statistical research.
5. Visualization tools (Google Looker Studio / Power BI)
How to create interactive dashboards and reports that executives understand.
Visualization rules:
- What you can show,
- what can't be shown,
- How to avoid manipulation.
6. Basics of forecasting
Forecasting based on real data. Regressions, dependencies, model building.
Project based learning
Every month - a project based on real cases:
- HR analytics,
- marketing metrics,
- financial metrics,
- forecasting,
- creating dashboards,
- business hypothesis testing.
It will help you to form a live professional portfolio and practice the studied knowledge on real tasks.
Bottom line
Data Science for Business is a course that makes people's work more conscious. This program is not about how to "build beautiful graphs", and not about how to "learn a new tool".
It's a program about how to think, how to analyze, how to make decisions based on data, not guesswork.
That's what most office workers lack today - and that's what we give you.